
Google Maps Exploration: Mapping Inequality
Objective: Students will investigate how wealth and infrastructure intersect by exploring neighborhoods across the U.S using Google Street View. The goal is to uncover how race, class, and geography shape access to safe and sustainable transportation.
Materials Needed:
-
Computer or tablet with internet
-
Google Maps (Street View access)
Step 1: Choose Four Neighborhoods
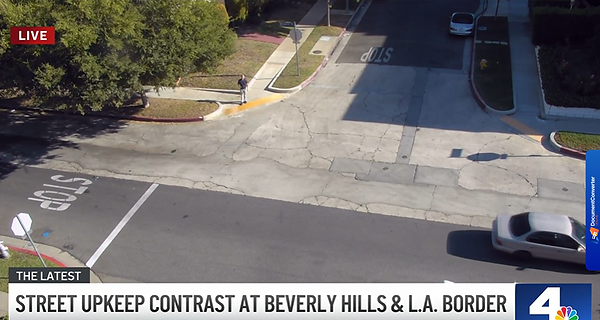
1) High-income urban area (ex: Beverley Hills, CA)
2) Under-resourced urban area (ex: South Central Los Angeles, CA)
3) High-income rural area (ex: suburban outskirts with large properties)
4) Economically marginalized Rural area (ex: Isolated rural towns with visibly limited public services)
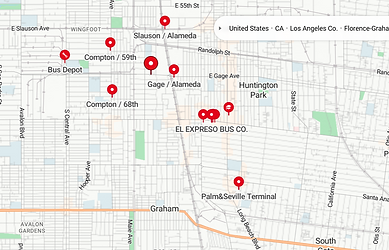

Step 2: Explore with Google Street View
Students should "walk" through each location and observe
1) Road & sidewalk quality
2) Transit stops and infrastructure
3) Bike lanes or shared mobility options
4) Lighting, signage, and street design
5) General upkeep, green spaces, and visible investment
Step 3: Reflect and Compare
1) What stood out to you in each area?
2) Which communities seem better supported by infrastructure?
3) How might these conditions affect safety, mobility, or opportunity?
Step 4: Propose a Change
1) One transportation or infrastructure improvement
2) Who would benefit from this change?
3) Why is it needed, and how could it be implemented?
